
Complete Guide to Free YouTube Analytics Tool

YouTube Analytics transforms raw viewership data into actionable insights that can dramatically impact your channel's growth trajectory. This comprehensive analytics platform, integrated directly into YouTube Studio, provides content creators and businesses with detailed performance metrics essential for strategic decision-making. Understanding how to leverage these powerful analytics tools can be the difference between stagnant growth and explosive channel expansion.
Why YouTube Analytics is a Must for Creators and Brands?
YouTube Analytics provides real-time data that reveals exactly how your audience finds and interacts with your content. The platform tracks viewer behavior patterns, showing you which parts of your videos keep audiences engaged and where they typically drop off. This immediate feedback loop enables creators to make informed adjustments to their content strategy without waiting weeks to assess performance.
Key benefits of real-time analytics include:
-
Immediate feedback on content performance
-
Quick identification of trending topics
-
Rapid response to audience engagement patterns
-
Early detection of viral content potential
Data suggests that channels actively using analytics grow 2.5 times faster than those relying solely on intuition. The analytics dashboard updates every 48-72 hours, ensuring you have access to relatively current performance indicators for quick pivots when needed.
Measure Video Engagement and Retention
Audience retention graphs serve as your content quality barometer, displaying precisely when viewers lose interest in your videos. These detailed analytics help you understand long your audience is watching and identify key moments for audience retention that could be replicated in future content.
The platform measures multiple engagement layers, including:
-
Likes and comment interactions
-
Share frequency across platforms
-
Subscription conversions from individual videos
-
Average session duration per viewer
According to YouTube's internal data, videos with retention rates above 60% are significantly more likely to appear in suggested video feeds, directly impacting your channel's organic reach.
Optimize Content Strategy Based on Trends
The analytics provide trend identification capabilities that guide content planning decisions. By analyzing your top content performance over time, you can identify topics and formats that resonate most with your audience. The system reveals seasonal patterns, helping creators anticipate when certain content types perform best.
Strategic optimization opportunities include:
-
Content topic performance analysis
-
Seasonal trend identification
-
Audience preference evolution tracking
-
Competitor performance benchmarking
YouTube creators who consistently analyze their metrics and adapt their strategy accordingly report 40% higher engagement rates compared to those who don't utilize these insights regularly.
How to Access YouTube Analytics?
Step-by-Step Guide to Enter YouTube Studio
Accessing your YouTube channel analytics requires just a few clicks through YouTube Studio. Follow these steps to reach your analytics dashboard:
-
Sign in to your YouTube account
-
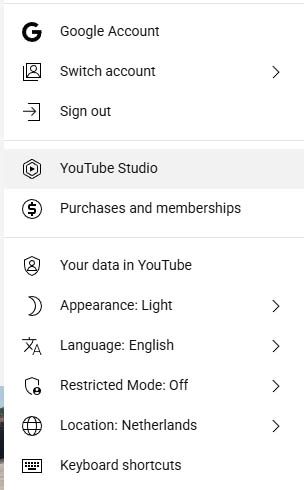
Click your profile picture in the top-right corner
-
Select "YouTube Studio" from the dropdown menu
-
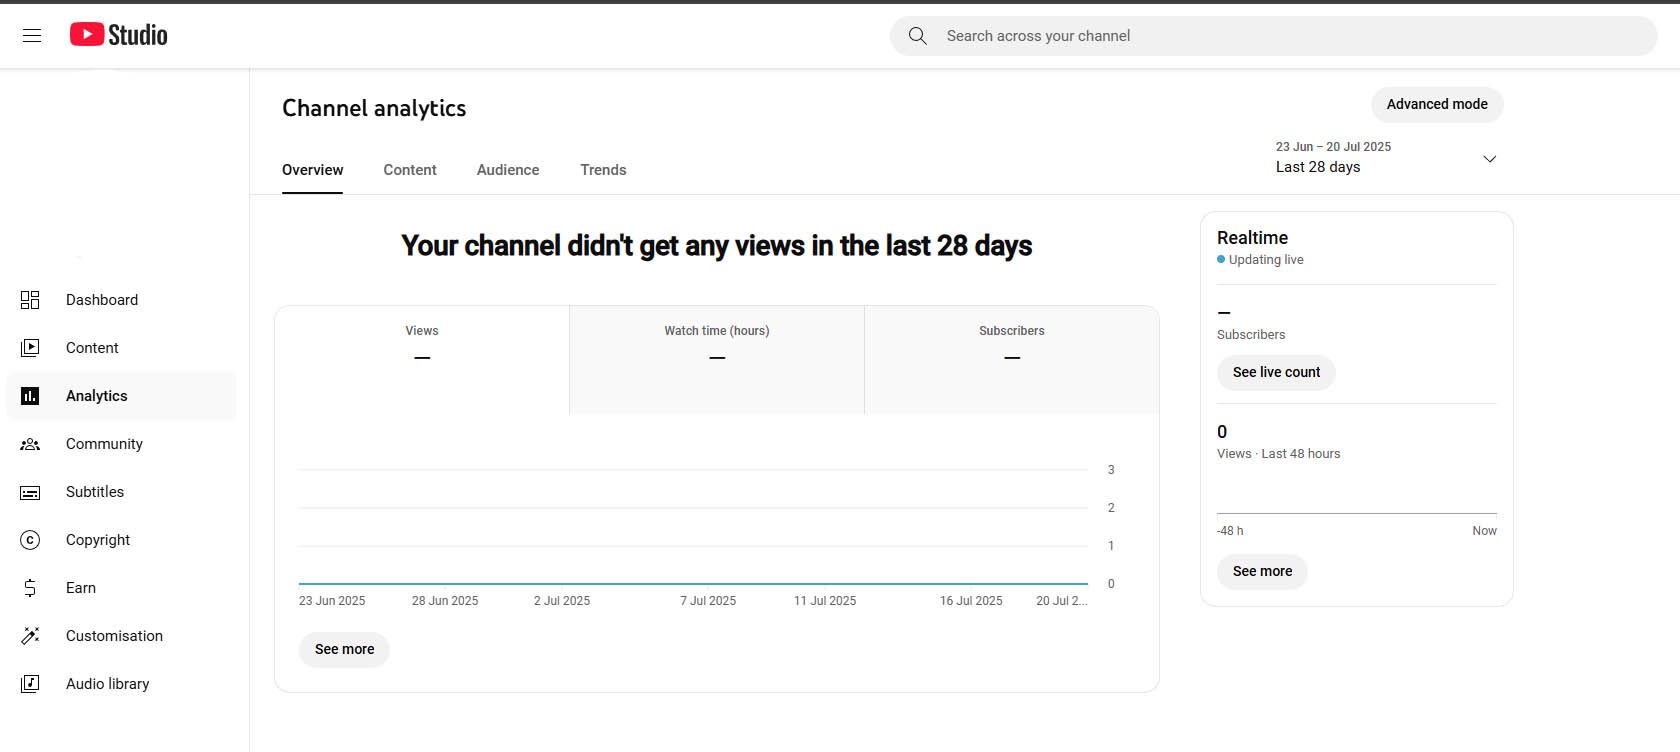
Navigate to the left sidebar and click "Analytics"
-
Choose your preferred analytics view (Overview, Content, Audience, or Revenue)
The YouTube Studio app also provides mobile access to key metrics, though the desktop version offers more advanced filtering and export capabilities for detailed analysis.
Overview of Key Tabs: Content, Audience, Research, Revenue
The analytics dashboard organizes data into four primary sections, each serving distinct analytical purposes. The Overview tab gives you a summary of essential performance indicators, including total watch time, subscriber count, and estimated revenue for monetized channels.
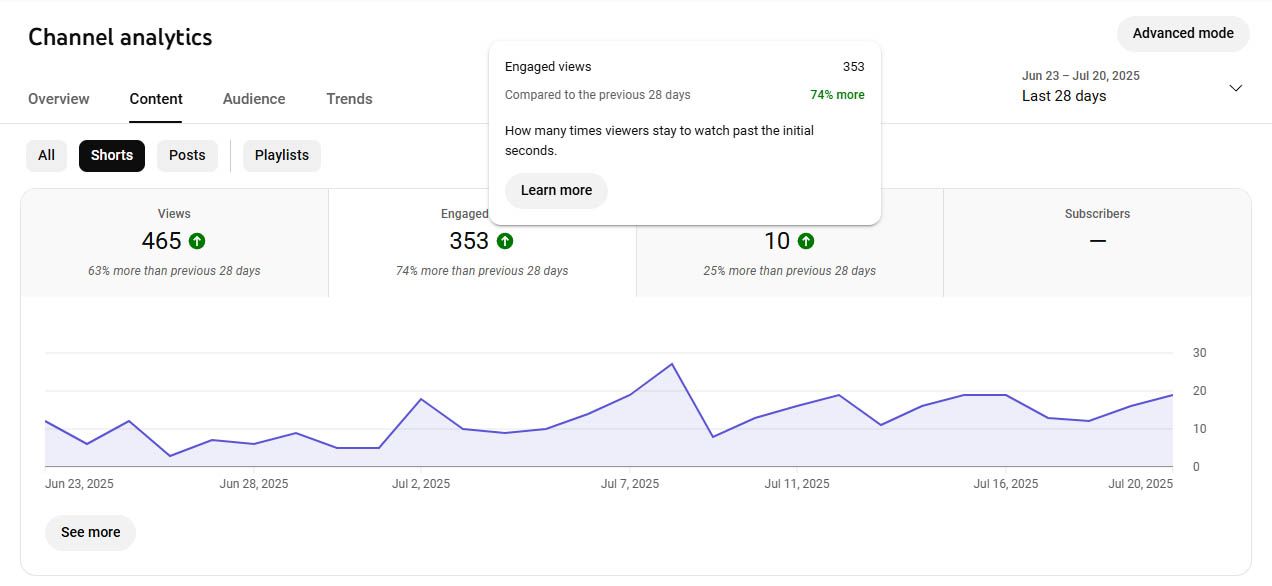
Content Tab Analysis: This section focuses on how audiences discover your videos through various traffic sources. Key metrics include impressions, click-through rates, and average view duration. You can filter performance by content type to compare how regular videos, Shorts, and live streams perform differently.
Audience Insights: The Audience tab delivers demographic breakdowns showing age, gender, geography, and viewing habits. It reveals when your viewers are most active on YouTube and what other channels they watch, providing valuable context for content planning.
Revenue Tracking: For YouTube Partner Program members, the Revenue tab tracks earnings from multiple monetization sources, including ads, memberships, and Super Chat. This data helps you track your earnings across different revenue streams and optimize monetization strategies.
Watch Time
Watch time represents the total minutes viewers spent watching your videos and serves as the most critical metric for YouTube's recommendation algorithm. Located prominently in your Overview tab, this metric directly influences your video's visibility across YouTube's platform.
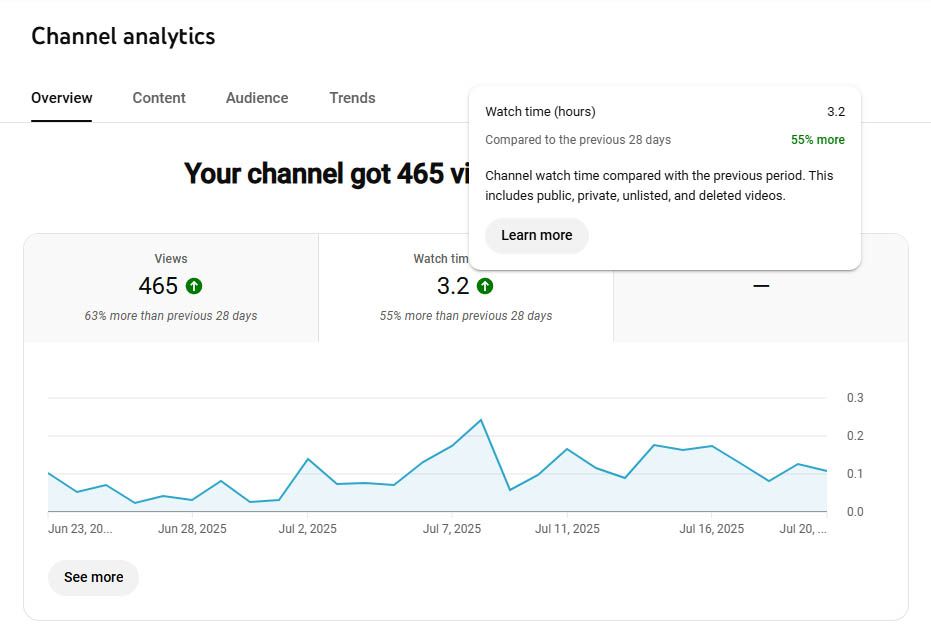
The analytics help you understand both total watch time and watch time per video, enabling performance comparison across your content library. Videos generating high watch time signal to YouTube's system that your content keeps viewers engaged, leading to increased promotion in search results and suggested videos.
Average View Duration
Average view duration indicates how long viewers typically watch before leaving your videos. Found within the Content tab under "Reach" metrics, this measurement reveals content quality and audience engagement levels more accurately than simple view counts.
According to a rule of thumb shared in a YouTube creators' community, “aim for at least 50–60% of your video’s length.” Videos that meet or exceed this threshold typically perform better in engagement and algorithmic visibility
Click-Through Rate (CTR)
Click-through rate measures what percentage of people who see your thumbnail and click to watch your videos. Typically ranging from 2-10% for most channels, CTR directly reflects the effectiveness of your video thumbnails and titles in attracting viewer attention.
Factors affecting CTR performance:
-
Thumbnail visual appeal and clarity
-
Title relevance and curiosity factor
-
Video topic alignment with audience interests
-
Competition level in your niche
Analytics provides detailed CTR breakdowns by traffic source, helping you understand which discovery methods work best for your content. Search-based impressions often show different CTR patterns compared to suggested video placements, allowing for targeted optimization strategies.
Audience Retention
Audience retention graphs display exactly when viewers stop watching, enabling targeted improvements to content structure and pacing. Access this crucial data through individual video analytics or aggregate channel-level reports in the Content tab.
Common retention optimization strategies include:
-
Strong video openings within the first 15 seconds
-
Strategic placement of retention hooks every 2-3 minutes
-
Elimination of unnecessary content segments
-
Improved pacing and editing techniques
See where viewers are dropping off most frequently and adjust your video structure accordingly. The first 15 seconds prove most critical, with successful videos maintaining at least 80% retention through this opening segment.
Rewatch Rate
Rewatch rate indicates which portions of your content provide such value that viewers return to watch specific segments multiple times. This metric, found in detailed video analytics, helps identify your most valuable content elements for replication in future videos.
High rewatch segments often become ideal candidates for YouTube Shorts or standalone content pieces, maximizing the value of your existing material while serving audience preferences.
Playlist Engagement
Playlist analytics reveal how effectively your content encourages binge-watching behavior. Strong playlist engagement indicates successful content sequencing and topic clustering that keeps audiences engaged across multiple videos.
The data shows session duration and video-to-video transition rates within playlists, helping optimize content organization for maximum watch time generation.
Traffic Sources
Understanding where your audience discovers your content enables strategic promotion decisions. YouTube analytics breaks down traffic sources, including:
-
YouTube Search - Organic discovery through platform search
-
Suggested Videos - Algorithm-recommended placements
-
Browse Features - Home page and subscription feed appearances
-
External Sources - Social media, websites, and direct links
-
Playlists - Organized content series engagement
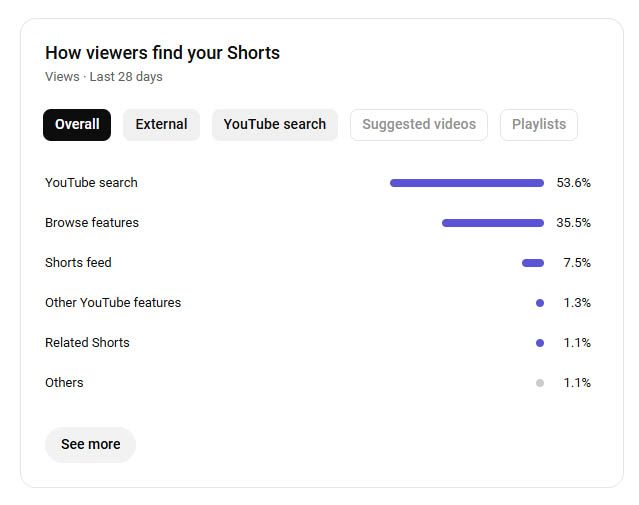
Each traffic source typically exhibits different viewer behavior patterns. Search-driven traffic often shows higher engagement rates, while external social media traffic might demonstrate shorter average view duration but higher subscriber conversion rates.
Demographics
Demographic data helps tailor content to your primary audience while identifying opportunities for expansion. The analytics provide detailed breakdowns showing which age groups engage most with your content and the geographic distribution of your viewership.
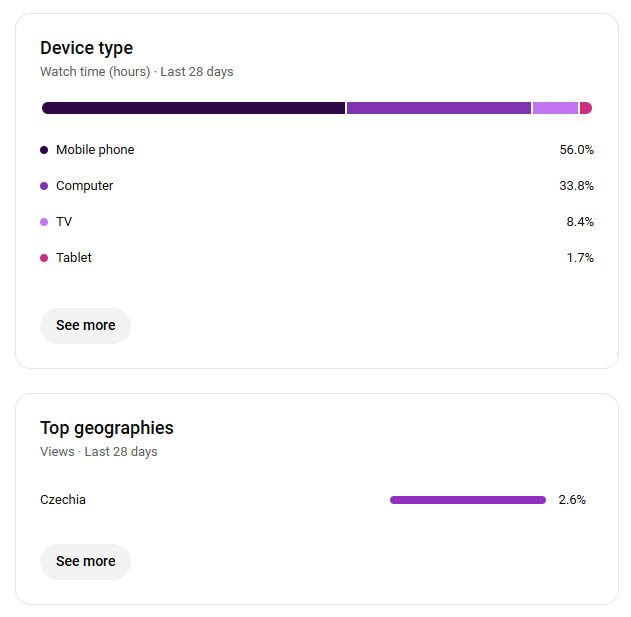
This information proves invaluable for brands considering sponsorship opportunities or creators planning community meetups and merchandise strategies.
Subscriber Growth Rate
Subscriber metrics reveal which content most effectively converts viewers into long-term followers. Analytics tracks both total subscriber count and subscribers gained per video, helping identify your most effective audience-building content.
The number of subscribers gained often correlates with specific content types or topics, providing clear direction for future content planning focused on audience expansion.
Core YouTube Metrics to Track
Essential metrics every creator should monitor for channel growth and optimization:
-
Watch Time
-
Location: Overview > Watch Time
-
Why It Matters: Primary ranking factor for YouTube algorithm
-
Benchmark Range: 4,000+ hours annually for monetization
-
Optimization Tips: Focus on longer-form, engaging content
-
-
Average View Duration
-
Location: Content > Reach
-
Why It Matters: Indicates content quality and engagement
-
Benchmark Range: 50-60% of total video length
-
Optimization Tips: Improve video pacing and structure
-
-
Click-Through Rate (CTR)
-
Location: Content > Reach
-
Why It Matters: Measures thumbnail/title effectiveness
-
Benchmark Range: 2-10% for most channels
-
Optimization Tips: Test different thumbnails and titles
-
-
Audience Retention
-
Location: Individual Video Analytics
-
Why It Matters: Shows exact drop-off points
-
Benchmark Range: 80% retention in first 15 seconds
-
Optimization Tips: Hook viewers early, maintain pacing
-
-
Subscriber Growth Rate
-
Location: Overview > Subscribers
-
Why It Matters: Tracks channel growth momentum
-
Benchmark Range: 1-5% monthly growth is healthy
-
Optimization Tips: Create subscriber-converting content
-
-
Impressions
-
Location: Content > Reach
-
Why It Matters: Shows content discovery potential
-
Benchmark Range: Higher impressions = broader reach
-
Optimization Tips: Optimize for search and suggestions
-
-
Revenue Per Mille (RPM)
-
Location: Revenue > Overview
-
Why It Matters: Earnings per 1,000 views after YouTube's cut
-
Benchmark Range: $1-5 RPM typical range
-
Optimization Tips: Target high-value demographics
-
-
Unique Viewers
-
Location: Content > Audience
-
Why It Matters: Actual audience size vs. repeat views
-
Benchmark Range: Should grow consistently over time
-
Optimization Tips: Expand reach beyond core audience
-
Mistakes to Avoid When Using YouTube Analytics
Ignoring Data Below Surface Metrics
Many creators focus exclusively on view counts while overlooking more meaningful engagement indicators. Critical metrics often ignored include:
-
Session duration and playlist engagement
-
Subscriber-to-view ratios and conversion rates
-
Geographic and demographic engagement variations
-
Mobile versus desktop viewing patterns
-
Comment sentiment and engagement quality
Watch time and average view duration provide significantly more insight into content quality and audience satisfaction than raw view numbers. Successful channel growth requires diving deeper into retention graphs, traffic source analysis, and audience behavior patterns.

Overemphasizing Vanity Metrics
While subscriber count and view totals feel rewarding, they don't necessarily indicate healthy channel growth or monetization potential. Focus on delivering value through content that generates high engagement rates and strong audience retention.
Metrics like watch time per subscriber and average view duration often predict long-term success more accurately than follower counts alone.
Misreading CTR Without Context
Click-through rate varies significantly based on traffic source and content type. Common CTR misinterpretations include:
-
Comparing search CTR with browse feature performance
-
Ignoring seasonal fluctuations in click behavior
-
Overlooking niche-specific CTR benchmarks
-
Failing to account for video age and algorithm changes
Search traffic typically shows higher CTR than browse features, while Shorts often demonstrate different click patterns compared to long-form content. Analyze CTR within the appropriate context for accurate interpretation.
Skipping Post-Publish Performance Tracking
Many creators upload content and forget to monitor performance during the critical first 48-72 hours when YouTube's algorithm makes initial promotion decisions. Early engagement patterns heavily influence long-term video performance.
Regular monitoring during this window allows for strategic promotion adjustments and community engagement that can significantly impact overall video success.
Grow YouTube Channel With Analytics: Recommendations
Improve Video Structure Based on Retention Graphs
Audience retention data reveals optimal video lengths and pacing for your specific audience. Analyze drop-off points across multiple videos to identify common patterns requiring structural adjustments.
Retention optimization techniques:
-
Strong Openings - Maintain 80% retention through the first 30 seconds
-
Strategic Hooks - Place engagement boosters every 2-3 minutes
-
Content Pacing - Vary tempo to maintain attention
-
Clear Transitions - Guide viewers smoothly between topics
-
Value Delivery - Front-load key information and insights
Create content with strong openings that maintain at least 70% retention through the first 30 seconds. Structure longer videos with retention "hooks" every 2-3 minutes to maintain engagement throughout extended content pieces.
Test Thumbnails and Titles Based on CTR Metrics
Use analytics data to guide thumbnail and title optimization experiments. A/B testing different visual approaches while monitoring CTR changes helps identify what resonates with your audience.
Elements to test systematically:
-
Color schemes and contrast levels
-
Text overlay placement and font choices
-
Facial expressions and emotional appeals
-
Brand consistency versus experimentation
-
Seasonal and trending visual elements
Successful thumbnail strategies often emerge from analyzing your highest-performing content's visual elements and adapting those approaches to new videos.
Rework Underperforming Content with Viewer Data
Analytics help identify content topics or formats that consistently underperform, enabling strategic pivots before investing additional resources in similar content approaches.
Transform unsuccessful video concepts by addressing specific issues revealed through retention graphs and engagement metrics rather than abandoning topics entirely.
Find Influencers That Match Your Growth Strategy Using Yoloco
In addition to native analytics, external platforms like Yoloco help accelerate channel growth through influencer collaboration. Yoloco’s YouTube discovery engine allows brands and creators to identify influencers by niche, audience quality, engagement rate, and location.
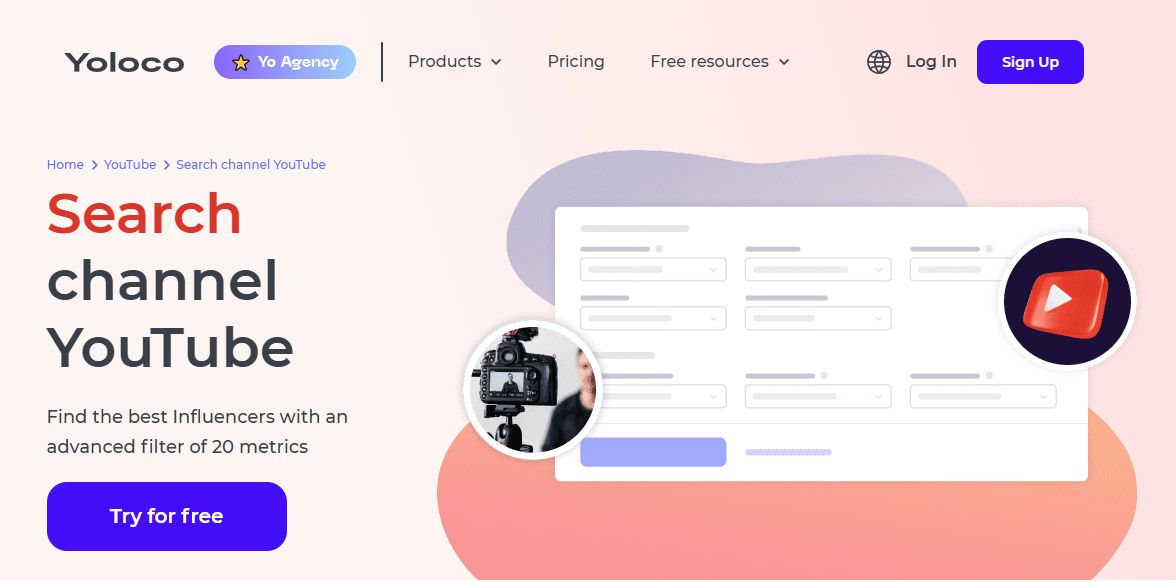
With Yoloco, you can:
-
Search YouTube creators by keyword, topic, or industry
-
Filter profiles using real metrics like subscriber authenticity, average views, and growth dynamics
-
Analyze content style and engagement history before outreach
-
Identify micro- and mid-tier influencers ideal for growth-focused collaborations
Integrating Yoloco into your analytics-driven workflow enables data-backed partnerships that extend your reach, improve brand alignment, and support sustained audience expansion.
Segment Subscribers to Personalize Recommendations
Advanced analytics reveal different subscriber segments based on viewing behavior and content preferences. Use this data to create targeted content series that serve specific audience interests while maintaining broad appeal.
Understanding subscriber behavior patterns enables strategic content scheduling and cross-promotion that maximizes engagement across your entire audience base.
Frequently Asked Questions
Is YouTube analytics free?
Yes, YouTube Analytics is completely free and included with every YouTube account. All creators have access to comprehensive performance data through YouTube Studio without any subscription fees or premium requirements.
Does YouTube analytics show your own views?
YouTube Analytics filters out your own views from official metrics to provide accurate audience data. However, you can still see your personal viewing activity in your YouTube watch history, separate from your channel's performance statistics.
How do I get to YouTube analytics?
Access YouTube Analytics through YouTube Studio by clicking your profile picture, selecting "YouTube Studio," then clicking "Analytics" in the left sidebar. Mobile users can also access key metrics through the YouTube Studio app.
Is YouTube analytics the same as Google Analytics?
No, these are different platforms serving distinct purposes. YouTube Analytics focuses specifically on video performance and channel metrics, while Google Analytics tracks website traffic and user behavior across web properties. However, both platforms can be integrated for comprehensive digital marketing analysis.
Can I export data from YouTube Analytics for external analysis?
Yes, YouTube Analytics allows you to export data in CSV format for further analysis in spreadsheets or third-party analytics tools. This feature is particularly useful when you need to combine YouTube metrics with other marketing data or create custom reports for clients or stakeholders.
What third-party analytics tools help better understand your channel performance?
Popular browser extension tools like TubeBuddy and VidIQ provide additional insights beyond native YouTube analytics. These tools help you see what resonates across YouTube by offering competitive analysis, SEO optimization features, and enhanced data visualization to grow your audience more effectively through comprehensive key metrics and reports.
How do I analyze data at the channel or video level for better insights?
YouTube Analytics allows you to view performance data at both channel and individual video levels. Access this data through the Content tab, where you can examine specific video performance or switch to channel-wide views. This flexibility helps you identify which video titles and topics generate the best audience engagement and provides a summary of how your audience interacts with different content types.
Understanding how to use YouTube Analytics effectively transforms casual content creation into strategic channel growth. The tools you need for success are already available within YouTube Studio – the key lies in consistent analysis and data-driven decision making that helps you understand what resonates with your audience and optimize accordingly.
23.12.2024
1474 article view
Similar articles
01.09.2025
Psychology Behind Influencer Marketing: Why People Trust Influencers
Understanding the psychology behind influencer marketing has become crucial for brands seeking authentic...
29.08.2025
Multi-Platform Influencer Strategies: Maximizing Reach Across All Channels
The digital marketing landscape has transformed dramatically, with influencer marketing emerging as a...
26.09.2024
Characteristics and values of Z generation
Who is Generation Z and Their Definition The term "Gen Z" describes those who were born from the late...