
How to Calculate Engagement Rate (The Formula Most Guides Get Wrong)
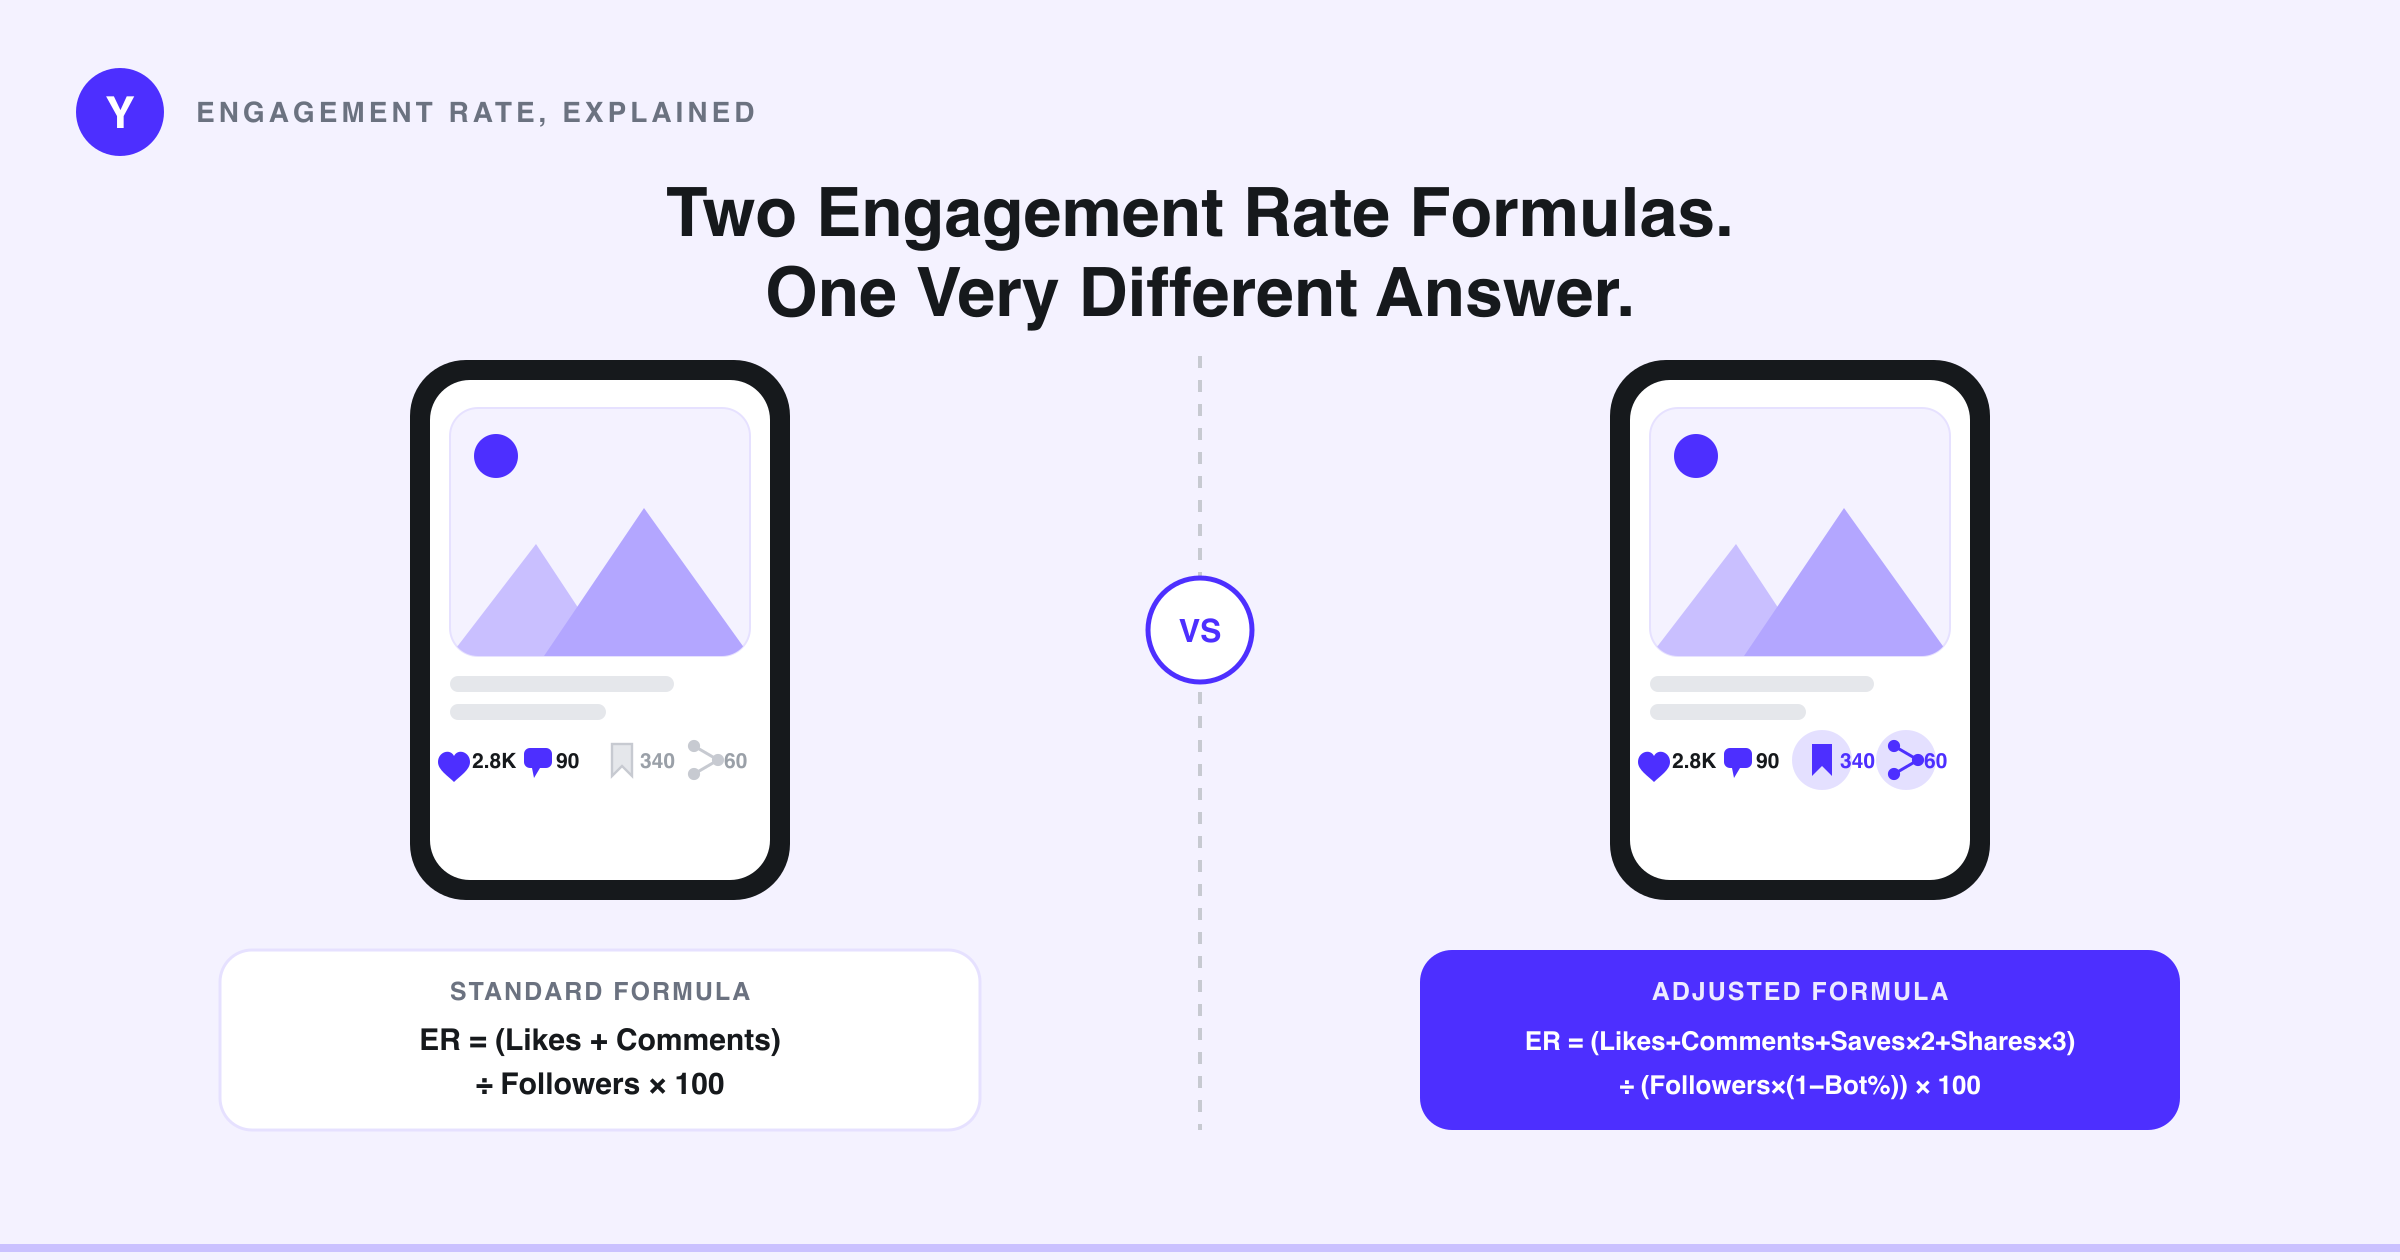
Most engagement rate calculators give you a single number and let you believe it. Plug in likes, comments, followers, get a percentage, compare it to a benchmark chart, done. That process breaks in two specific places. The formula itself ignores saves and shares, which are the two signals Instagram and TikTok weight hardest in distribution. And the benchmark you're comparing against means nothing until you know the platform, the follower tier, and how many of those followers are real humans. Raw ER is a screening filter. Treat it as a decision metric and you'll pay premium rates to a creator running an engagement pod, or pass on someone genuinely strong because their number looks average.
The Standard Engagement Rate Formula (and Why It Breaks Down)
The formula everyone uses:
ER = (Likes + Comments) / Followers × 100
This formula became the industry default years ago, when likes and comments were the only engagement signals platforms exposed and the only ones third-party tools could reliably scrape. It hasn't been updated since, even though Instagram, TikTok, and YouTube have all rebuilt their ranking systems around signals it doesn't count.
Here's where it fails. Take a creator with 100,000 followers who averages 4,000 likes and 200 comments per post.
ER = (4,000 + 200) / 100,000 × 100 = 4.2%
That reads as strong — above the 1.5–3% mid-tier benchmark this creator should actually be judged against (100K followers is mid-tier by the benchmarks below, not macro). But if 30% of that follower base is bots or inactive accounts, the real audience isn't 100,000, it's 70,000. Bots don't like or comment, so all 4,200 of those engagements came from the 70,000 real people. Recalculate against real followers and ER jumps to 6.0%, a full 1.8 points above the number on the media kit. That's the part most buyers get backwards: a bloated, bot-heavy follower count doesn't inflate ER, it dilutes it. The accounts that look artificially strong aren't the ones with fake followers — they're the ones running engagement pods, which is the failure mode below.
The bigger omission is saves and shares — the formula counts neither. Both platforms have said as much in public: Instagram's Adam Mosseri has repeatedly pointed to sends and shares as the signals that matter most for Reels reach, and TikTok has been open that watch time and completion rate drive its For You recommendations far more than likes do. A formula that ignores saves and shares isn't measuring engagement. It's counting how many people tapped a heart, which is the easiest, lowest-intent action on the platform.
Engagement Rate Benchmarks by Platform and Follower Tier
A 3% ER is mediocre for a nano account and excellent for a macro one — the same number means opposite things depending on scale. Here's what normal actually looks like:
- Instagram — Nano (1K–10K): 5–8% · Micro (10K–50K): 3–5% · Mid-tier (50K–500K): 1.5–3% · Macro (500K+): 0.9–1.5%
- TikTok — Nano: 10–15% · Micro: 6–10% · Mid-tier: 3–6% · Macro: 2–4%
- YouTube — Nano: 2–4% · Micro: 1–2.5% · Mid-tier: 0.8–1.5% · Macro: 0.5–1%
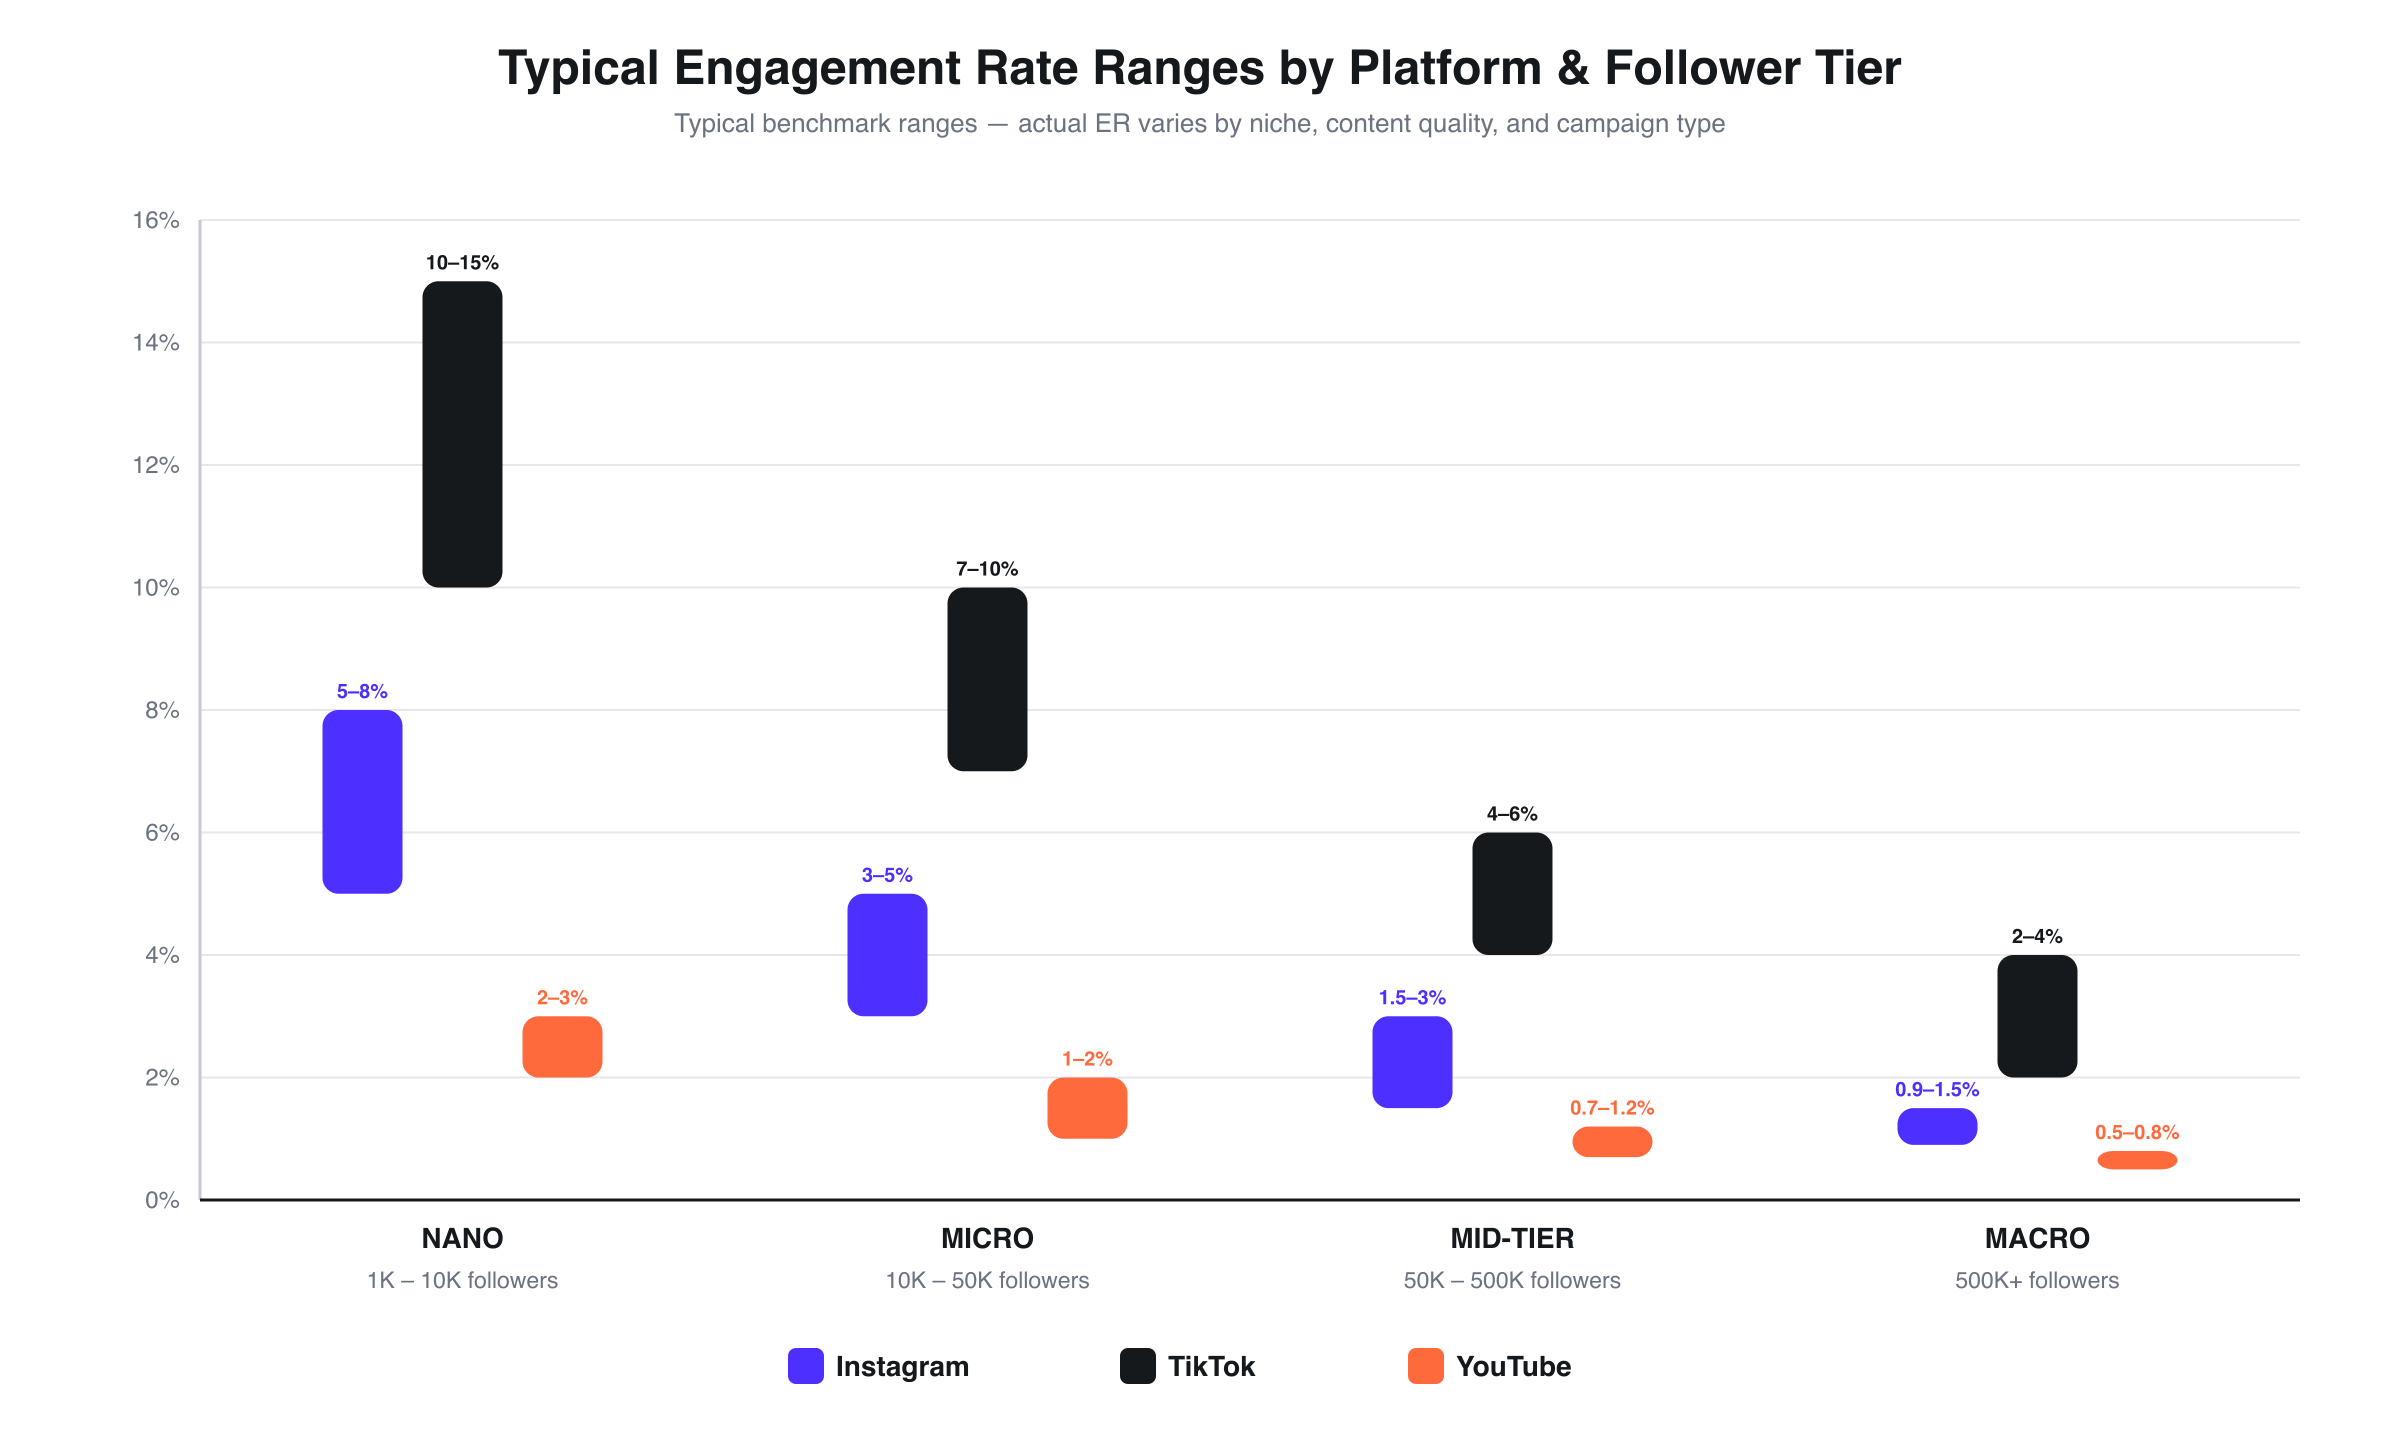
Typical engagement rate ranges by platform and follower tier.
TikTok sits well above Instagram at every comparable tier — roughly 1.5–3x depending on where you look — and the reason isn't that TikTok audiences care more. TikTok's ranking system weights completion rate and rewatch behavior more heavily than likes, so the app pushes content to non-followers constantly, and every one of those extra views can turn into an engagement without anyone following the account. A nano TikTok creator hitting 12–15% ER isn't an outlier; it's the median for that tier.
YouTube sits at the bottom of the raw-number range for a structural reason: the denominator is subscribers, but a huge share of views come from suggested and browse traffic that has nothing to do with the subscriber count. A video can pull 200,000 views on a 40,000-subscriber channel, which drags the ER math down even when the audience is deeply engaged. YouTube also captures the highest-value form of engagement — rewatches and long-session views — that none of these ER formulas count at all.
This is why comparing a YouTube channel's 1.2% to an Instagram account's 1.2% as "equal engagement" is one of the most common mistakes brands make when building a roster. They're not the same unit of measurement. It's comparing miles per gallon to kilometers per liter and assuming the numbers mean the same thing because they look similar.
Why Raw ER Lies: Bots, Pods, and the Metrics It Doesn't Count
Two failure modes push ER in opposite directions, and both make the number less trustworthy.
Engagement pods are private groups, usually Telegram or WhatsApp chats, where 20 to 200 creators agree to like and comment on each other's posts within minutes of publishing. Fast, coordinated early engagement is exactly what triggers algorithmic boost on Instagram and TikTok, so pod members get a real distribution lift from fake-feeling activity. The effect on ER: pods typically inflate the number by 2 to 4 percentage points above what organic audience behavior alone would produce. A mid-tier Instagram account posting 2.5% organic can look like 5–6% with an active pod, landing comfortably inside "strong engagement" while the actual audience is lukewarm.
Follower buying does the opposite and creates a more dangerous illusion. A creator with 50,000 followers who bought 15,000 of them ends up with an ER that looks worse than it should, because purchased followers never like, comment, save, or share anything — they're bots or abandoned accounts. That drags ER down, and a lower number paradoxically reads as "more authentic" to anyone using ER alone as an anti-fraud signal. The account isn't authentic. It's just diluted in the other direction.
The fix is a cross-check, not a better calculator: run an audience quality check alongside ER before you trust either number in isolation. If a quality report shows 20%+ suspicious followers, don't take the displayed ER at face value — recompute it against real followers instead of total followers. A 3% ER on a profile with 25% suspicious followers is functionally closer to 4% once you divide the same engagement by the smaller, real audience, and that's the number worth bringing to a rate negotiation.
The Adjusted Formula: Audience-Quality-Weighted Engagement Rate
Here's the version that actually accounts for what platforms reward and who's really watching:
Adjusted ER = [(Likes + Comments + Saves×2 + Shares×3) / Real Followers] × 100

Real Followers = Total Followers × (1 - Bot %)
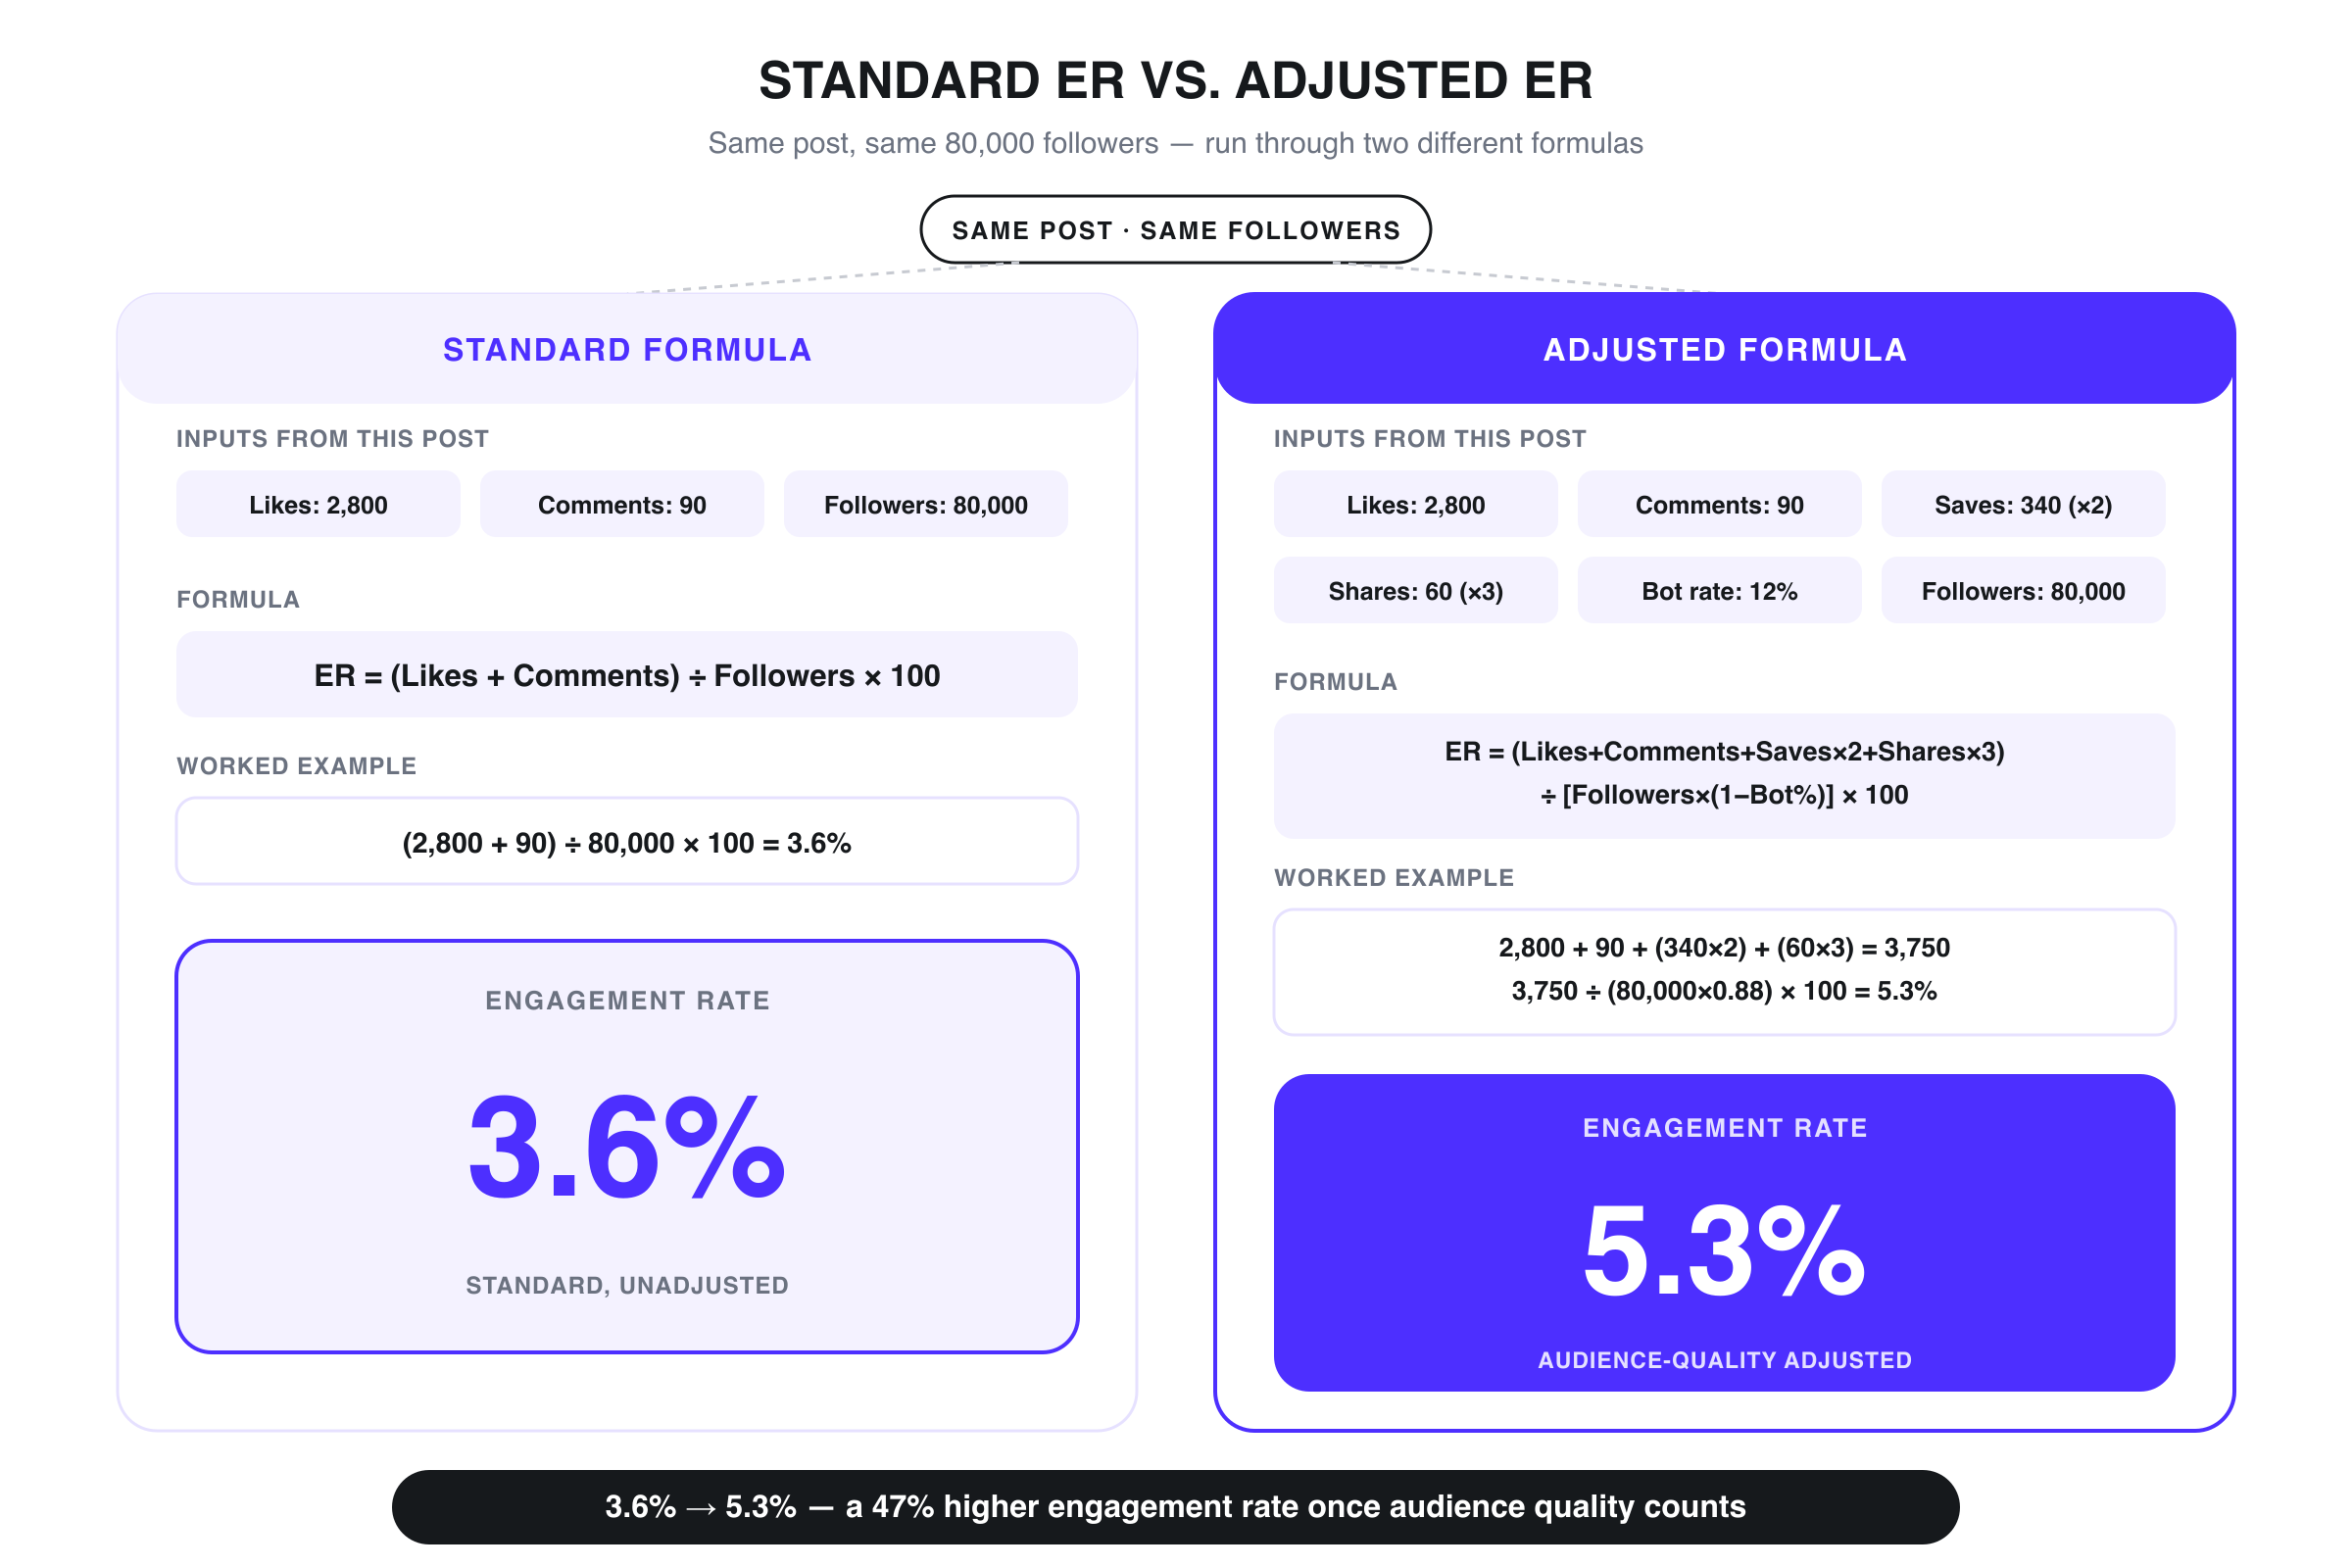
Standard ER vs audience-quality-adjusted ER, using the same real post data.
The weights are a deliberate heuristic, not an empirically derived constant. Saves and shares track algorithmic reach far more closely than likes do — a save signals intent to return, a share puts the content in front of a new, unrelated audience — so weighting them above likes pushes the formula toward what platforms actually reward. Treat 2x and 3x as a reasonable starting point you can tune per platform, not a law of physics. A like costs a viewer nothing. A save means they intend to come back. A share means they staked their own reputation on the content being worth someone else's time.
Worked Example: Calculating It on a Real Profile
Take a creator with 80,000 followers. Their average post pulls 2,800 likes, 90 comments, 340 saves, and 60 shares. An audience quality check comes back showing 12% bot/inactive followers.
Standard ER:
(2,800 + 90) / 80,000 × 100 = 3.6%
That lands right at the low end of the Instagram mid-tier benchmark — unremarkable, easy to overlook in a shortlist of twenty creators.
Now the adjusted version. Real Followers first:
80,000 × (1 - 0.12) = 70,400
Weighted numerator:
2,800 + 90 + (340 × 2) + (60 × 3) = 2,800 + 90 + 680 + 180 = 3,750
Adjusted ER:
3,750 / 70,400 × 100 ≈ 5.3%
That's nearly 1.7 points higher than the standard calculation, and it flips this creator from "average mid-tier" to genuinely strong. This is the mirror image of the pod-inflation problem: the raw number understated quality because it ignored save/share behavior and diluted against a follower count that included dead accounts. A brand scanning ER alone would skip this profile in a stack of a hundred others. A brand running the adjusted formula — or vetting a shortlist at scale with a creator search tool built for this — would flag it as a priority booking. Skip the manual math next time and run your own numbers through the free calculator.
When Low ER Is Fine, and When High ER Is a Red Flag
ER drops as follower count rises — that's not a quality signal, it's arithmetic. Growing an account from 10,000 to 500,000 followers means adding people with progressively weaker parasocial connection to the creator, so the denominator grows faster than genuine engagement can keep up. Comparing a 5% nano creator against a 1.2% macro creator and calling the nano creator "better" is comparing different physics, not different content quality. Judge each against its own tier.
The real red flag runs the other direction: an ER sitting above 8% at a tier where 2–3% is normal, paired with comments that say nothing specific. Strings of fire emoji, "❤️❤️❤️," "so good!" These are generic reactions that could sit under any post. That combination is a stronger pod-activity signal than the ER number itself, because pods produce volume without producing substance; bot comments and paid engagement rings are fast, early, and content-blind.
Rule of thumb: any time a creator's ER exceeds their tier benchmark by more than 2x, read the top 20 comments before you trust the number. Real engagement references specific details — a product, a joke, a moment in the video. Pod and bot engagement doesn't, because it's generated by people (or scripts) that never actually watched.
FAQ
How do you calculate engagement rate?
The standard formula is ER = (Likes + Comments) / Followers × 100. It's fine as a first-pass filter, but it ignores saves and shares and treats every follower as real. For a number you can actually make booking decisions on, use the audience-quality-adjusted formula above, which weights saves and shares higher and divides by real followers instead of total followers.
What is a good engagement rate for an influencer right now?
It depends entirely on platform and follower tier — there's no single "good" number. On Instagram, 3–5% is solid for a micro-influencer (10K–50K) but weak for a nano account, where 5–8% is typical. On TikTok, expect numbers 1.5–3x higher across the board. On YouTube, anything above 1.5% at mid-tier is strong because the raw-number ceiling is naturally lower.
Why is my engagement rate dropping as my follower count grows?
Because the denominator grows faster than your most engaged fans multiply. Early followers tend to have a direct, personal connection to your content; as you scale into broader distribution, you pick up casual followers who see your content less often and engage with it less intentionally. A drop from 6% to 2% between 20K and 200K followers is normal, not a sign your content got worse.
Do saves and shares count toward engagement rate?
Not in the standard formula most tools default to, which only counts likes and comments. They should. Instagram and TikTok both weight saves and shares more heavily than likes in their own distribution algorithms, so the adjusted formula in this piece counts saves at 2x and shares at 3x the value of a like.
How do bot followers affect engagement rate calculations?
Bot and inactive followers inflate the denominator without ever contributing to the numerator, since they don't like, comment, save, or share. That mechanically suppresses standard ER — a 50,000-follower account with 15,000 bought followers shows a lower ER than the same account with 35,000 real followers, even though the engaged audience is identical. Adjust by recalculating against real followers (total followers × (1 − bot %)) instead of total followers.
Is TikTok engagement rate always higher than Instagram's?
At comparable follower tiers, usually yes, typically by 1.5–3x. TikTok's ranking system weights completion rate and rewatches more heavily than likes, so posts reach far more non-followers than an equivalent Instagram post would, generating more total engagement relative to follower count. Don't compare a TikTok ER directly to an Instagram ER without adjusting for this baseline gap.
What engagement rate should brands require before paying for a sponsored post?
Set the bar relative to the creator's specific platform and tier, not a flat number — require at or above the tier benchmark, then verify with influencer analytics that confirm the engagement is real, not just present. A creator hitting benchmark ER with under 10% suspicious followers and comments that reference actual content specifics is a safer bet than one exceeding benchmark by 2x with generic comments and no audience quality data available.
If you're also comparing tools to run these checks at scale, see how the options stack up: Yoloco vs Modash and Yoloco vs HypeAuditor.
Similar articles

How to Vet Influencers Before You Pay: A 6-Point Checklist
Every media kit you get from a creator is a sales document. It's built to close the deal, not to inform your decision,...

Micro-Influencer Marketing: Why Smaller Creators Convert, and How to Run a Program
A $300 post from a 35,000-follower baking creator will often outperform a $50,000 post from a celebrity with 2...

How to Find Influencers for Your Brand
The fastest way to find influencers for your brand is to search by who follows a creator, not just what that creator...
Find creators who actually move your audience
Define any audience, get the creators who really influence it — with engagement and audience quality up front. Free to start.